Summary of Udaipur City Energy Consumption and
GHG Emissions (2019-20)
City Profile & Overview of GHG Emissions:
With an area of 64 sq km and population of 4.51 lakhs (Census 2011), it is the only municipal corporation in the district and is 6th largest city among cities having more than 1 lakh population in the state. The city is divided into 70 election and revenue wards and has seen increase in its area from 37 sq km in 2001 to 64 sq km in 2013. It acts as an industrial, administrative, and educational center of the region. It was one of the first 20 cities to be selected under GoI’s Smart City Mission (SCM) in 2015.
Udaipur has witnessed multi-fold development in the last two decades owing to the development of industrial, administrative, and educational centres in the region. It is a popular tourist destination and is known for its history, culture, scenic locations and Rajput-era palaces. It is also known as a ‘City of Lakes’ due to its sophisticated lake system with five major lakes namely – Fateh Sagar Lake, Lake Pichola, Swaroop Sagar Lake, Goverdhan sagar and Doodh Talai Lake.
UMC population accounts for 2.65% of the urban population of the state and 74.14% of the urban population of the district1. Being a tourist city and famous internationally as one of the most beautiful city in the world, it attracts more than a million tourists annually from across the globe. Tourism sector is the largest contributor to the city’s economy. Foreign tourists comprise around 22-24%, while domestic tourists comprises 76–78%2.
Table 1 City Profile
| Local Government Udaipur Municipal Corporation | |
| State | Rajasthan |
| Population | 451100 as per census 2011 |
| Area | 64 Sq km |
| No. of Zones | – |
| No. of Wards | 70 |
| No. of Households | 93980 as per census 2011 |
| Household Size | 4.8 as per census 2011 |
Table 2 GHG Emissions from Udaipur City
| GHG Emission Scenario of Udaipur City in 2019-20 | |
| Total Energy Use (GJ) | 1,00,94,646.49 |
| Total GHG Emission (tCO2e) | 20,84,882.92 |
| Per Capita Energy Use (GJ) | 19.35 |
| Per Capita GHG Emission (tCO2e) | 4.00 |
| Emissions from Waste Sector (tCO2e) | 1,06,481.07 |
- Interim City Development Plan (CDP), 2014, Udaipur
- RTDC, Surajpole, Udaipur
Community-Scale Energy Consumption & GHG Emissions: Energy Consumption by Udaipur City in (2019-20):
Table 3 Sector-wise Energy Consumption in 2019-20
| Sector Energy Use (GJ) | |
| Stationary Units | 69,13,259 |
| Residential Buildings | 33,22,213 |
| Commercial and Institutional Buildings/Facilities | 10,54,457 |
| Manufacturing Industry and Construction (i.e., Industrial sector) | 25,06,890 |
| Agriculture, forestry and fishing activities (i.e. mainly agriculture) | 29,700 |
| Mobile Units | 31,81,387 |
| On-Road Transportation | 31,81,387 |
| Total | 1,00,94,646 |
Waste Generated and Treated at Udaipur City in 2019-20:
Table 4 Waste Sector Activity Data
| Waste Sector Activities Data Unit | ||
| Solid Waste Management | ||
| Daily MSW Generated | 211.24 | TPD |
| MSW Biologically Processed –
composting |
3.28 | TPD |
| MSW Biologically Processed –
Biomethanation |
– | TPD |
| MSW Processed –
Incineration/Recycling |
– | TPD |
| MSW Disposal in landfills* | 208 | TPD |
| Wastewater Management | ||
| Daily Waste Water Generated | 76.80 | MLD |
| Treatment Capacity | 45 | MLD |
| Sewerage Network Coverage | 36.35 | % |
| Population coverage using Septic tanks | 63.65 | % |
| Population coverage using pit latrines | – | % |
| Discharge of wastewater without treatment | 0 | % |
| Inlet BoD (Organic load) | 180 | Mg/L |
*City’s landfills categorised as wet/dry, shallow/deep, managed/unmanaged contribute different levels of emissions
GHG Emissions from Udaipur City in 2019-20:
Table 5 Sector-wise GHG Emission in 2019-20
| Sector GHG Emissions (tCO2e) | |
| Stationary Units | 17,43,751 |
| Residential Buildings | 3,93,648 |
| Commercial and Institutional Buildings/Facilities | 2,02,357 |
| Manufacturing Industry and Construction | 11,40,958 |
| Agriculture, forestry and fishing activities | 6,788 |
| Mobile Units | 2,34,651 |
| On-Road Transportation | 2,28,641 |
| Rail | 6,010 |
| Aviation | 0 |
| Waste | 1,06,481 |
| Solid Waste Disposal | 78,377 |
| Biological treatment | 417 |
| Incineration and open burning | 0 |
| Wastewater | 27,687 |
| Total | 20,84,883 |
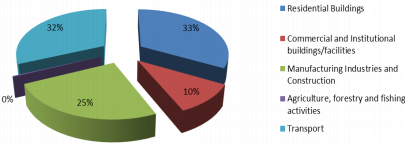
Figure 1 Sector-wise Energy consumption in Udaipur, (2019-20)
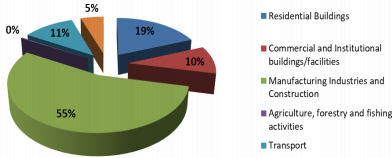
Figure 2 Sector-wise GHG emission in Udaipur, (2019-20)
∙ Total Community-Scale Energy use in 2019-20: 10094646.49 Giga Joules
∙ Largest Energy consumers: Residential Buildings, Transport and manufacturing industries and construction
∙ Total community-scale GHG emission in 2019-20: 2084882.92 tonnes of CO2e ∙ Largest GHG emitters: Manufacturing industries and construction, residential buildings, transport
Trend of Energy Consumption and GHG Emission in Udaipur City from 2017-18 to 2019-20:
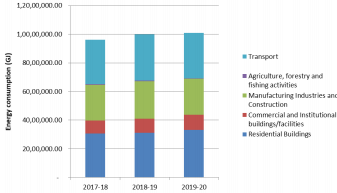
Figure 3 Trend of energy consumption in Udaipur during 2017-18 to 2019-20
The trend of energy consumption in Udaipur is increasing at an annual average growth rate (AAGR) of 1.7% AAGR from 2017-18 to 2019-20. Commercial and institutional building sector witnesses the highest 5.7% AAGR, followed by Residential buildings (2.7%) and Transport sector (0.9%). The reason behind the significant change in the energy consumption of Commercial and institutional building sector is because Udaipur is the hub for all the commercial and institutional activities for the nearby five districts and is one of the major tourism destinations in India. Agriculture activities are reducing in the city area so the trend of energy consumption in this sector is showing negative.
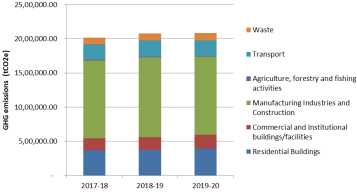
Figure 4 Trend of GHG emission in Udaipur during 2017-18 to 2019-20
Trend of GHG emission is increasing at 1.1% AAGR from 2017-18 to 2019-20. The Commercial and institutional building sector witnessed the highest 4.8% AAGR, followed by Waste (3.5%), Residential buildings (2.5%) and Transport sector (0.8%). The reason behind the significant change in the energy
consumption of Commercial and institutional building sector is because Udaipur is the hub for all the commercial and institutional activities for the nearby five district and one of the major tourism destination in India.
Supply Side Energy Consumption and associated GHG Emissions:
Primary and secondary energy sources supplied to the demand-side sectors for consumption are referred to as the supply-side sources. These include liquid, solid and gaseous fuels, electricity and renewable sources of energy. Grid electricity is the dominant energy type that is typically used in almost all sectors. Petroleum products are used extensively for community transportation in the Udaipur city.
Energy Consumption and GHG Emission based on Energy Source in 2019-20:
Table 6 Supply side-based Energy Consumption and GHG Emission in 2019-20
Fuel/Energy Source
Energy Use by Source Category (GJ) (2019-20)
GHG emission by Source Category (t CO2e) (2019-20)
| Stationary
Units |
Mobile
Units |
Stationary
Units |
Mobile
Units |
|
| Diesel | 0 | 15,38,372 | 0 | 1,14,384 |
| Petrol | 0 | 16,39,708 | 0 | 1,14,048 |
| Natural Gas | 0 | 0 | 0 | 0 |
| LPG | 24,45,308 | 3,307 | 1,54,433 | 208.85 |
| Kerosene | 8,151 | – | 588 | – |
| Coal | 15,76,554 | – | 1,56,309 | – |
| Biogas | 13,830 | – | 7,76,612 | – |
| Indirect Electricity | 28,69,416 | – | 6,55,808 | – |
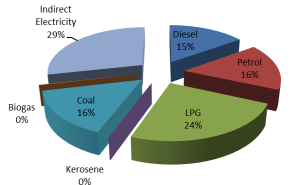
Figure 5 Source-wise supply side energy consumption in Udaipur, (2019-20)
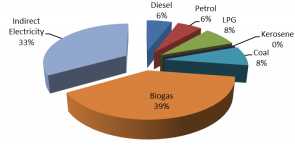
Figure 6 Source-wise supply side GHG emission based on energy source in Udaipur (2019-20)
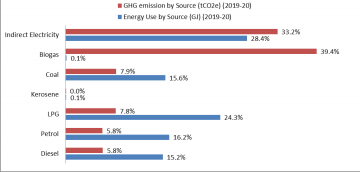
Figure 7 Source-wise supply side energy consumption and GHG emission in Udaipur, (2019-20)
∙ Prominently used Energy sources: Electricity
∙ Total community-scale GHG emission from energy consumption in baseline year: 1972392 tonnes of CO2e
∙ Largest GHG emitting Energy sources: Biogas
Local Government Level Energy Consumption & GHG Emissions:
Energy Consumption and GHG Emission by Udaipur Municipal Corporation in 2019-20:
Table 7 Sector-wise Energy Consumption and GHG Emission by Udaipur Municipal Corporation in 2019-20
| Sector Energy Use (GJ) GHG emission (tonnes of CO2e) | ||
| Buildings | 4,284.00 | 979.11 |
| Waste Water Treatment | 23,283.93 | 5,303.83 |
| Water Supply | 84,813.62 | 19,384.26 |
| SWM | – | – |
| Street Lighting | 28,944.00 | 6,615.19 |
| Transport | 20,796.44 | 1,546.29 |
| Total | 1,62,121.99 | 33,828.68 |
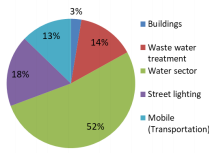
Figure 8 Energy consumption due to local government activities in Udaipur, (2019-20)
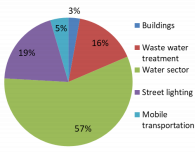
Figure 9 GHG emissions due to local government activities in Udaipur, (2019-20)
∙ Total Energy use in (2019-20) by the local government: 162121.99 Giga Joules ∙ Largest Energy consumers: Water Supply is the top most energy consuming service with a contribution of 52% followed by Street Lighting which is 18%.
∙ Total GHG emission in (2019-20) by the local government: 33828.68 tonnes of CO2e ∙ Largest GHG emitting sector: Water Supply is the top most energy consuming service with a contribution of 57% followed by Street Lighting which is 19%.
Trend of Energy Consumption and GHG Emission by Local Government:
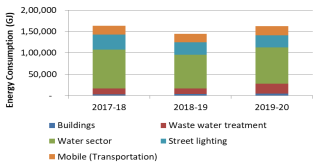
Figure 10 Trend of energy consumption due to local government activities in Udaipur during (2017-18) to (2019-20)
Trend of energy consumption is decreasing at 0.2% AAGR from 2017-18 to 2019-20. Waste water treatment sector witnesses the highest 25.6% AAGR, followed by Buildings sector 10.3% and transport 0.5%. UMC has increased the waste water treatment capacity in year 2019-20 to 45 MLD from 20 MLD so energy consumption in this segment have increased. Street Lighting sector is showing negative because of installation of energy efficient light.
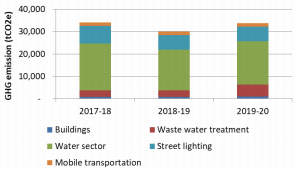
Figure 11 Trend of GHG emission due to local government activities in Udaipur during (2017-18) to (2019-20)
Trend of GHG emission is decreasing at 0.3% AAGR from 2017-18 to 2019-20. Waste water treatment sector witnesses the highest 25.6% AAGR, followed by Buildings sector 10.3% and transport 0.5%. UMC has increased the waste water treatment capacity in year 2019-20 to 45 MLD from 20 MLD so emissions in this sector have increased. Street Lighting sector is showing negative because of installation of energy efficient LED lighting in the city.